Forex Rectangle chart pattern
A Rectangle or Box is a continuation pattern and describes a price pattern where supply and demand seems evenly balanced for an extended period of time. The currency pair moves in a tight range, finding support at the rectangle's bottom and hitting resistance at the rectangle'...
A Rectangle or Box is a continuation pattern and describes a price pattern where supply and demand seems evenly balanced for an extended period of time. The currency pair moves in a tight range, finding support at the rectangle’s bottom and hitting resistance at the rectangle’s top. Rectangle patterns are also known as Trading Ranges, Consolidation Patterns, Flat Base and a Sideways Pattern. 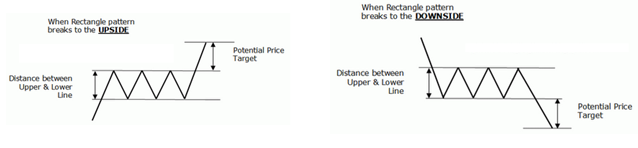 Look durations work best for this pattern. The potential price target is usually considered to be the same height as that of the rectangle. A pattern over 3 weeks is a good indication. A 3 month duration is expected to meet the breakout potential (height of the rectangle) while a 6 month pattern can exceed the breakout target. Validate and draw a Rectangle Pattern There should be a minimum of 4 reversal points to draw 2 parallel lines. Two equal peak for resistance and two equal valleys for support. In addition the distance between the two peaks and valleys should be almost the same. This indicated a valid rectangle pattern. Caution on how to Trade the Rectangle Pattern Note: You should note that while the breakout is likely in the same direction as the previous breakout, it could also go the other way. So when trading on a rectangle pattern, it is best to trade both ways, with a stop-loss on each side. Irrespective of which side it move you make a killing on one direction that will easily cover the small loss on the opposite direction.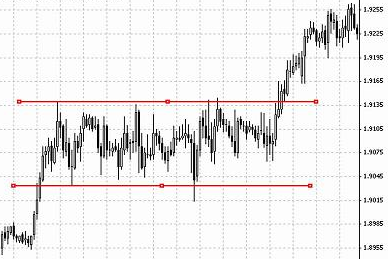
../../trading-courses/technical/triangles)

-
Rectangles
Ready to Practice This Strategy?
Test what you learned on a free, risk-free demo account before risking real money.