How to establish Support and Resistance?
**Plotting Support and Resistance Lines** Sometimes the candlestick body goes past the support or resistance line, but does not follow through with the momentum. It jumps back the opposite way. These are called 'false breakouts'. So avoid falling into this trap. To filter out ...
Plotting Support and Resistance Lines Sometimes the candlestick body goes past the support or resistance line, but does not follow through with the momentum. It jumps back the opposite way. These are called “false breakouts”. So avoid falling into this trap. To filter out these false breakouts, you should think of support and resistance more of as “zones” rather than concrete numbers.
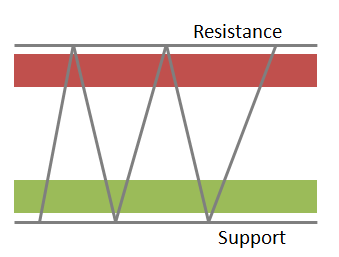
It’s because orders tend to get clustered around these areas of supply and demand. There are traders who place stops there, and there are traders who place orders to trade in the direction of the break. And because support and resistance levels are where orders are clustered, prices tend to move towards them. Identifying Zones One way to help you find these zones is to plot support and resistance on a line chart rather than a candlestick chart. The reason is that line charts only show you the closing price while candlesticks add the extreme highs and lows to the picture. Then plot support and resistance lines through the clearly highlighted zones where you can see the price forming several peaks or valleys. ../../trading-courses/technical/support-and-resistance-levels) ../../trading-courses/technical/trading-trend-lines-and-channels) - Support and Resistance levels - Methods to establish support and resistance? - Trading trend lines and channels
Ready to Practice This Strategy?
Test what you learned on a free, risk-free demo account before risking real money.