Fibonacci (+) trend lines & Channels
Fibonacci can be used with channels in making your trading decisions. Channels are built using several parallel trend lines. To make this working example we used an unit width channel. Then, parallel lines are drawn at the values equal to the Fibonacci Numbers, beginning with ...
Fibonacci can be used with channels in making your trading decisions. Channels are built using several parallel trend lines. To make this working example we used an unit width channel. Then, parallel lines are drawn at the values equal to the Fibonacci Numbers, beginning with 0.618-fold size of the channel, then 1.000-fold, 1.618-fold, 2.618-fold, 4.236-fold, etc. As soon as the fifth wave finishes, correction in the direction opposite to the trend can be expected. It is important to note that for proper use of Fibonacci with Channels, the base line limits the upper part of the channel when trend is ascending and the lower part of it when trend is descending. 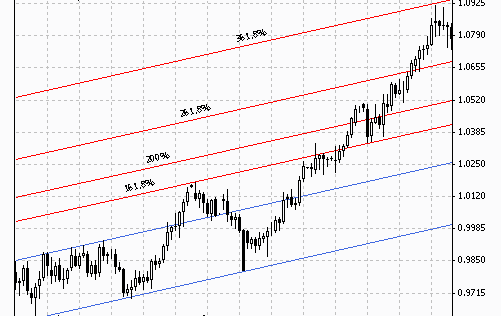 Fibonacci channels are an advanced Fibonacci technical indicator helpful in determining support and resistance levels. They are variations of Fibonacci retracement lines, and are drawn diagonally rather than horizontally. Fibonacci channels can be applied to both long-term and short-term trends, and to up trends and downtrends.
 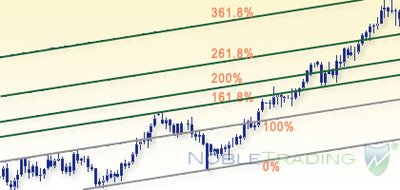 Many modern trading systems allow traders to draw Fibonacci channels over price charts. First a base channel is created connecting a significant price top and price bottom. Then the first slopping line is created by connecting two tops (in an uptrend) or two bottoms (in a downtrend). Then parallel lines are drawn above or below this line at key Fibonacci levels of 23.6%, 38.2%, 50% and 61.8% of the original base channel width (done automatically by the trading system). Traders can also extend the levels to beyond 100% (161.8%, 200%, 261.8%, etc) if there is significant trends. Interpreting Fibonacci channels is just like horizontal Fibonacci retracements. When one line is crossed in an uptrend it becomes support and above line becomes resistance. Similarly when one diagonal channel line is crossed in a downtrend it becomes resistance and below line becomes support. Most traders use Fibonacci channels with Fibonacci retirements and the price levels when they cross are given significant importance.
../../trading-courses/technical/caution-when-trading-fibonacci)

-
Fibonacci & Trend lines
Ready to Practice This Strategy?
Test what you learned on a free, risk-free demo account before risking real money.