RSI & Stochastic profitable system
We use 1h GBP/JPY chart here. And Stochastic Oscillator (5, 3, 3) and RSI (7) are used for indicators to define where a breakout is happening. 1. SELL when RSI and Stochastic are overbought (75) or close to that line, and we have negative candle (black or red filled) closed be...
We use 1h GBP/JPY chart here. And Stochastic Oscillator (5, 3, 3) and RSI (7) are used for indicators to define where a breakout is happening. 1. SELL when RSI and Stochastic are overbought (75) or close to that line, and we have negative candle (black or red filled) closed below the middle of the last positive candle (clear or blue filled). 2. BUY when RSI and Stochastic are oversold (25) or close to that line, and we have positive candle (clear or blue filled) closed above the middle of the last negative candle (black or red filled). 3. If you are in a SELL trade, exit when the condition which meet for BUY trade and enter a new trade. Stop loss can be put at -100pips. 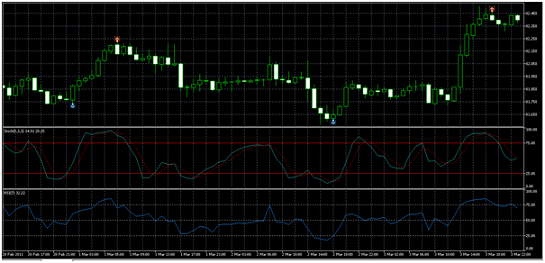
Risk Disclosure & Testing
Past performance of any trading strategy is not indicative of future results. Always backtest and forward test this strategy on a free demo account before committing real financial capital.
Practice This Strategy on a Live Demo
Choose an ECN broker with tight spreads and fast execution for strategy backtesting.