Multiple time frame Bollinger Bands
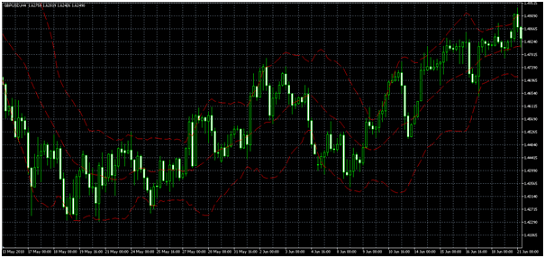
Using longer timeframe chart to find the direction of a trend and using shorter time frame chart to determine the entry point. If we use **daily chart** as longer time frame chart, with a **Bollinger Band** with default setting, the middle line is the 20 SMA. If a pair is trad...
Using longer timeframe chart to find the direction of a trend and using shorter time frame chart to determine the entry point. If we use daily chart as longer time frame chart, with a Bollinger Band with default setting, the middle line is the 20 SMA. If a pair is traded above the 20 SMA, it is in an up trend. If a pair is traded below the 20 SMA, it is in a down trend. Then we can move to the shorter time (e.g. 4 hour or 1 hour). Here we are looking for the weakness or strength of the trend that we identified on daily chart. For an uptrend, we are looking for the price touching the lower bands (weakness). For a down trend, we are looking for the price touching the upper bands (strength). These weakness/strength points become our entry points. The below charts show an up trend starting from May 20 on daily chart. On 4 hour chart, a weakness point was found on May 25. That could be a good time to enter in a long position. 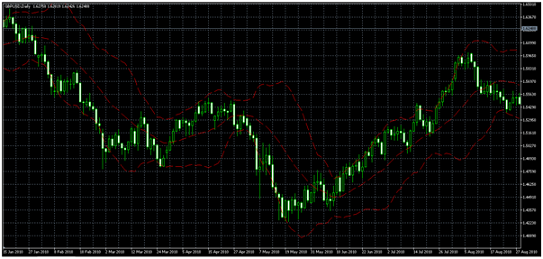
Risk Disclosure & Testing
Past performance of any trading strategy is not indicative of future results. Always backtest and forward test this strategy on a free demo account before committing real financial capital.
Practice This Strategy on a Live Demo
Choose an ECN broker with tight spreads and fast execution for strategy backtesting.