4 hours Bollinger Band
Bollinger Band is a great tool to detect resistance and support. In this strategy, a 20 period Bollinger Bands is used as indicator. Any currency pair can be used and 4 hours charts are preferable. Take a H4 USD/CAD as an example. The upper band of BB (20, 2) acts as resistanc...
Bollinger Band is a great tool to detect resistance and support. In this strategy, a 20 period Bollinger Bands is used as indicator. Any currency pair can be used and 4 hours charts are preferable. Take a H4 USD/CAD as an example. The upper band of BB (20, 2) acts as resistance and lower band as support. Most of time price approaches touches or even pierces the upper band but immediately retraces back to the lower band. The strategy here is simple. Wait until the price touches the upper band and closes under it (meaning it doesn’t break the upper band and resistance is still valid). Enter short position when the candle finishes. Profit target will be the lower band or 100 pips. You could set stop loss for 1:3 risk reward ratio based on your profit target. A long position could be entered when the price touches the lower band but closed above it. 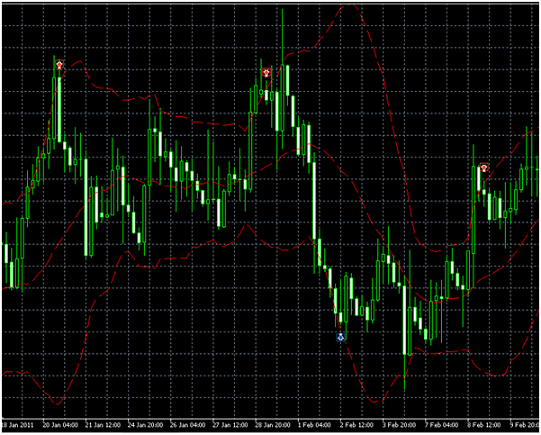
Risk Disclosure & Testing
Past performance of any trading strategy is not indicative of future results. Always backtest and forward test this strategy on a free demo account before committing real financial capital.
Practice This Strategy on a Live Demo
Choose an ECN broker with tight spreads and fast execution for strategy backtesting.