Triangles
**Trading Symmetric Triangles** The triangle pattern is a combination of two converging trend lines (support levels & resistance levels) and is: (1) A bearish formation that occurs when a currency pair shows downtrend as a continuation pattern (downtrend will continue) or (2) ...
Trading Symmetric Triangles The triangle pattern is a combination of two converging trend lines (support levels & resistance levels) and is: (1) A bearish formation that occurs when a currency pair shows downtrend as a continuation pattern (downtrend will continue) or (2) A bullish formation that usually forms during a currency pair uptrend as a continuation pattern (in which case the uptrend will continue) This pattern is confirmed when the currency pair price breaks out of the symmetrical triangle formation; (1) To the downside and closes below the lower support trend line in order to continue the downtrend (or) (2) To the upside and closes above the upper resistance trend line in order to continue the uptrend. 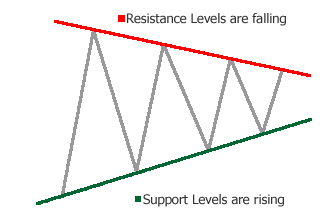 How to trade this pattern? For its best prediction, an established trend should exist, either a strong down or a strong uptrend. Once the currency pair breaks out the symmetrical triangle, most likely, the price will continue its previous trend. Trade the breakout!
 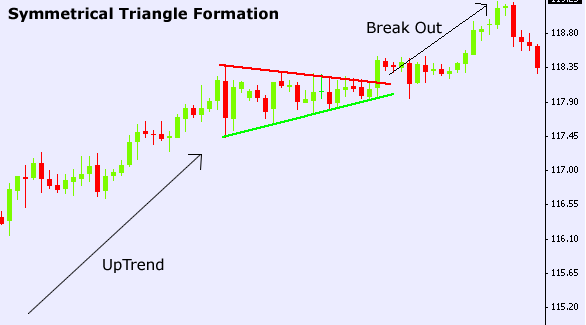 Please note how the previous trend is an uptrend, once it breaks out the symmetrical triangle, it’s uptrend continue! In addition to the Symmetric Triangle Pattern, there are 2 others forms: Ascending triangles and descending triangles. Their detailed explanation will follow in future training courses.
../../trading-courses/technical/tops-and-bottoms) ../../trading-courses/technical/rectangles)
-
Triangles
Ready to Practice This Strategy?
Test what you learned on a free, risk-free demo account before risking real money.