Forex charts - Types of charts
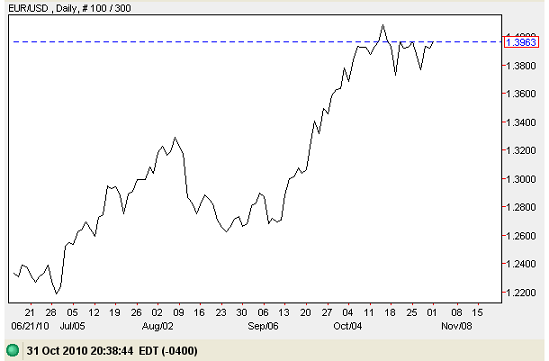
A typical line chart shows a series of straight lines which connect neighboring closing prices of a currency. You can see a general price movement of a currency pair over a period of time. The chart below is a daily line chart of EUR/USD between June 21 and Oct 31, 2010. Every...
Line Chart
A typical line chart shows a series of straight lines which connect neighboring closing prices of a currency. You can see a general price movement of a currency pair over a period of time. The chart below is a daily line chart of EUR/USD between June 21 and Oct 31, 2010. Every trading day, a new closing price is taken and connected to previous day’s closing price with a straight line.
Bar Chart
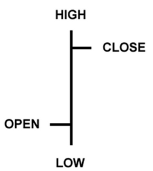
Bar charts are more complicated than line charts, but they provide much more information too. A typical bar chart shows opening and closing prices, as well as high and low prices of a period. This is also why bar charts are referred as OLHC charts (open, low, high and close). Note that a period’s opening price does not always equal to previous period’s closing price. And a period’s closing price can be higher or lower than, or equal to a period’s opening price. Below chart shows EUR/USD price movement during the same period but in bar chart. One can clearly see that there is more information here than in the line chart. ../../trading-courses/technical/candlestick-charts) - Forex charts-basics - Candlestick charts and reading it - Trends explained
Ready to Practice This Strategy?
Test what you learned on a free, risk-free demo account before risking real money.