Chart stop loss
More experienced traders and technical analysts prefer using charts as the means to decide their stop losses. They derive the point of exit using methods such as support and resistance. For example as shown in the illustration below, the currency pair creates a strong support ...
More experienced traders and technical analysts prefer using charts as the means to decide their stop losses. They derive the point of exit using methods such as support and resistance. For example as shown in the illustration below, the currency pair creates a strong support level and a trend line, subsequently breaking the trend line. At this point your technical analysis shows two stop loss possibilities. Now it is up to the traders discretion to choose one or the other. 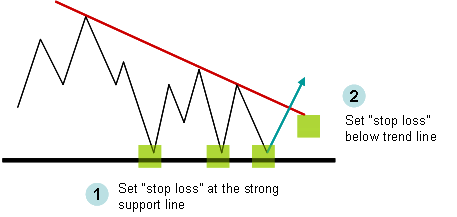 You should remember that no stop loss orders work perfectly at all times. If the above support level was breached as a result of sudden fundamental news, a large number of stops may be activated at the same time. With sellers will far exceed buyers, the price will fall sharply. Nevertheless, they are an effective way to limit capital loss.
../../trading-courses/riskmanagement/equity-stop-loss) ../../trading-courses/riskmanagement/volatility-stop-loss)
-
Chart stop loss
Ready to Practice This Strategy?
Test what you learned on a free, risk-free demo account before risking real money.